

How to Use the Line Chart in Excel
Line Chart is used to display trends in data over a particular time period. Line charts are best used when the data is arranged in such a way that text labels, dates, or a few numeric labels are on the horizontal axis.
Example:
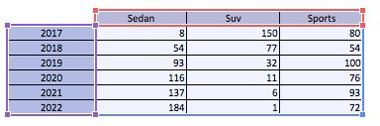
We have the below data relating to car sales over a 6-year period that we want to present in a line chart.
Solution:
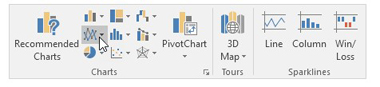
1. Select the data range including headers.
2. On the Insert tab, in the Charts group, click on the Line symbol.
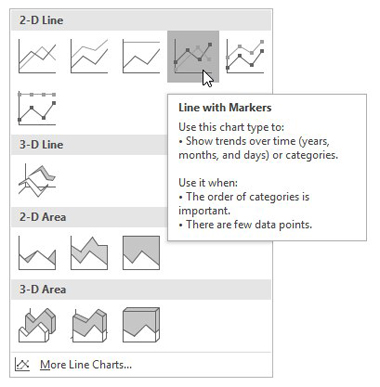
3. Click the type of chart you want, in this example we selected Line with Markers.
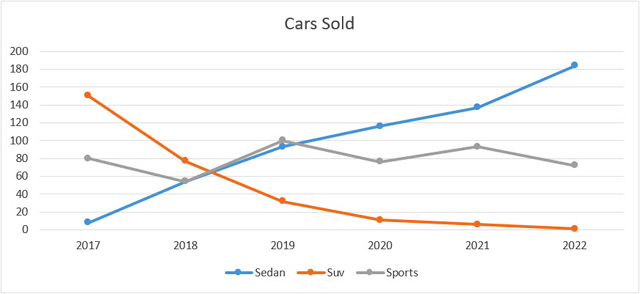
4. Result:
This is very to perform in newer versions of Excel and you just want to select the data and then really just click on the insert button in the top menu and then select a chart from there you will be able to customize it to your linking!
I hope that helps. Please leave a comment below with any questions or suggestions. For more in-depth Excel training, checkout our Ultimate Excel Training Course here. Thank you!


0 Comments