

How to Create Report Filter Pages in Excel
To create Report Filter Pages in Excel, there is a function available for pivot tables that allows you to automatically create separate tabs summarizing the pivot table data and split up by a specific category or customer per tab. This allows you to create filter pages automatically!
There is this function within Excel that allows you to create separate tabs which summarize the Pivot Table data and split it up by specific categories or by customers per tab.
This can be extremely useful especially in the case where you got a workbook where you are working with a ton of data and the pivot has multiple options. In that case, instead of creating hundreds of tabs manually, this function will allow you to create the tabs automatically.
Example:
A Financial Analyst has a headcount sheet of employees who have been working in various departments and with specific roles.
The Financial Analyst would like to create a summary of employee salary split up by each role and department, with each department having its own tab.
Steps:
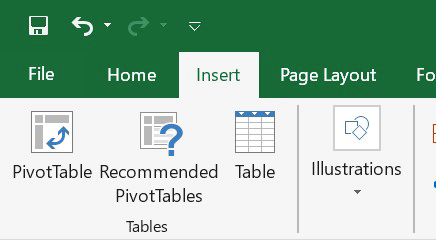
1. Select the table, and go to Insert>PivotTable.
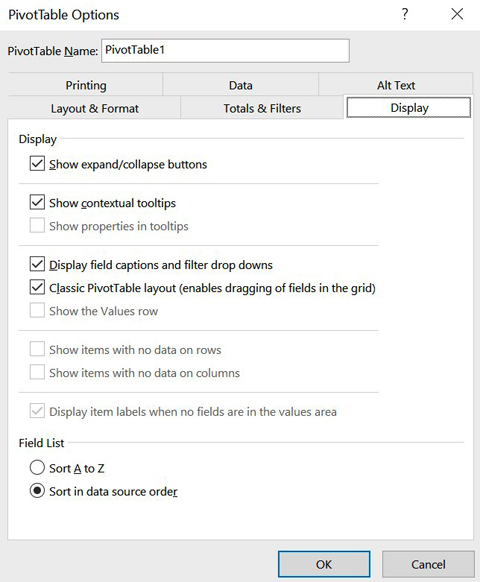
2. Go to PivotTable Options, and select the classic Pivot Table layout from the Display option.
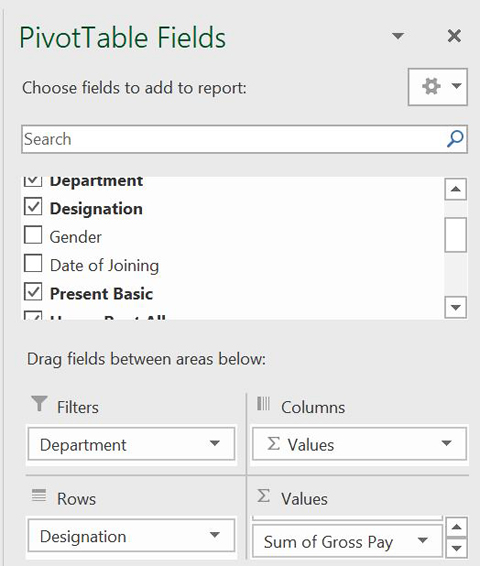
3. Put “Designation” into Rows, “Department” into Filter, and “present Basic”, “House Rent”, “Medical”,”Transport”, “Special”, and “Gross Pay” into Values.
4. Now, go to Analyze>PivotTable. Click the down icon of Option, and select the “Show Report Filter Pages….”
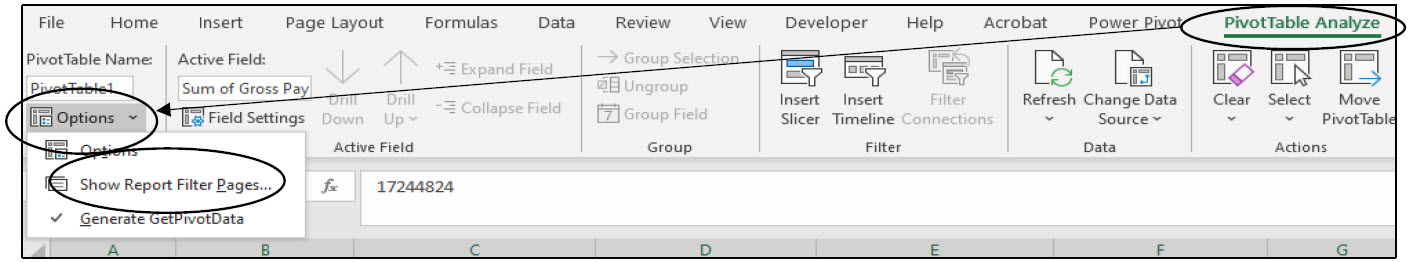
5. Excel will create an individual sheet for each department automatically after selecting “Show Report Filter Pages…”.
Raw Data:
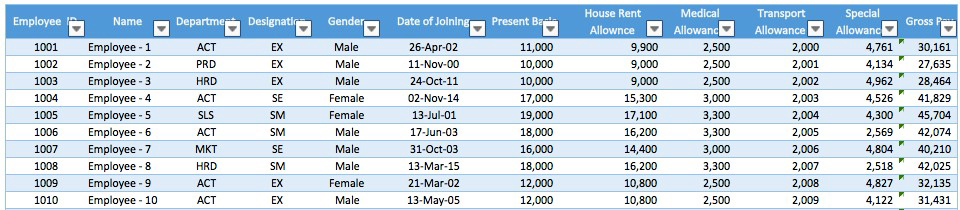
*Note this table is only a sample of an example with few data entries, and the formulas are based on the whole population of raw data which are not reflected in the example.
As you can see, this is a very powerful tool within Excel if you need to create individual tabs containing reports based on a specific filter. And after learning how to perform it, I recommend building it into your financial reporting going forward.
I hope that helps. Please leave a comment below with any questions or suggestions. For more in-depth Excel training, checkout our Ultimate Excel Training Course here. Thank you!


0 Comments