

What is Scenario Manager in Excel
Scenario Manager function in excel can be used for making different scenario such as good, bad, moderate, based on certain range of output/input which impact the ultimate outcome.
Where to find Scenario Manager in Excel:
Go to:
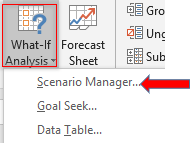
Data>Forecast>What-If Analysis>Scenario Manager
1. Data
2. Forecast
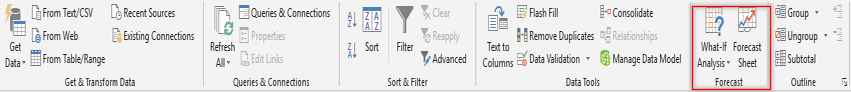
3. What-If Analysis – Scenrario Manager
How to use Scenario Manager Function in Excel:
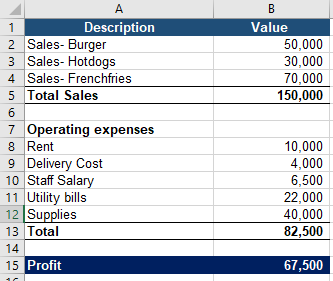
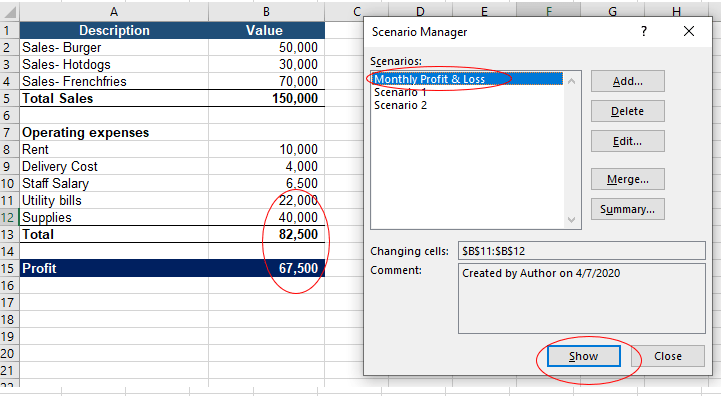
Let’s take an example of XYZ company to understand$ the different fields of Scenario Manager Function. Total profit of the XYZ company for the month is 67,500. The company want to see the impact of increase/decrease in cost of supplies and utility bills on its monthly profit. Scenario Manager Function of Excel helps XYZ Company to see what the monthly profit of the company will be if values of supplies and utility bills change.
Step 1: Create a table in excel showing monthly Profit & Loss of the company.
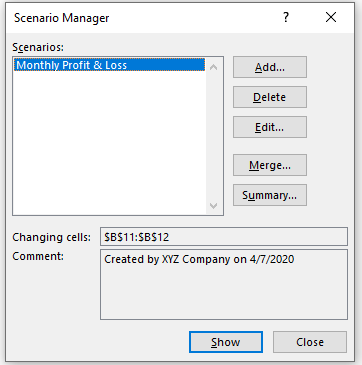
Step 2: By clicking on Scenario Manager Following dialog box will open:
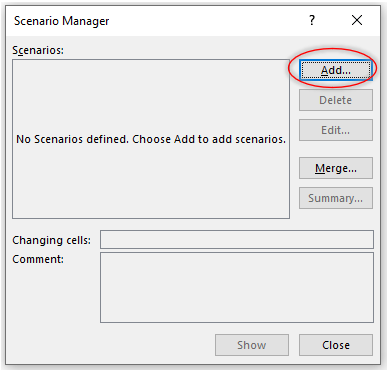
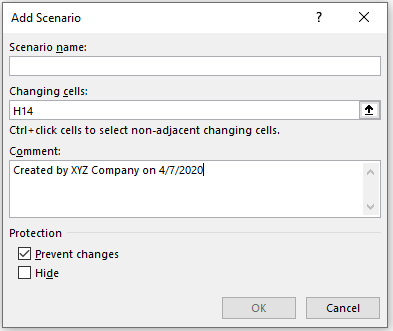
Step 3: Now add a new scenario by clicking on Add button. Following dialog box will open.
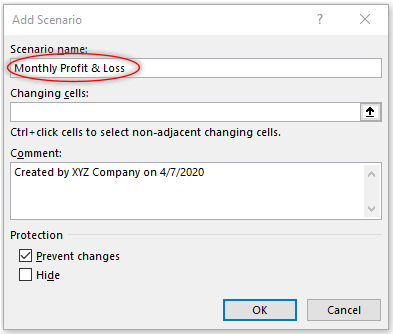
Type the Scenario name, in our example we are going to name it “Monthly Profit & Loss”:
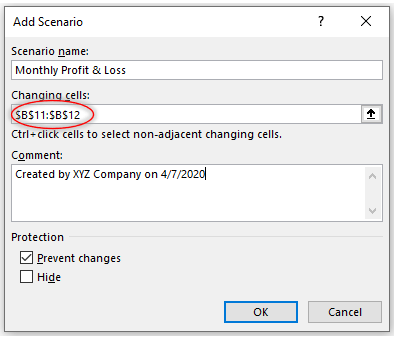
Changing cells field will allow the cells which hold our values which we want to change. As XYZ wants to see the impact of supplies and utility bills cost on its profits. Therefore, select cells that contain value of supplies and utility bills.
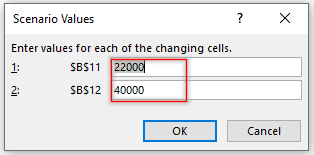
Click OK and change the values of supplies and utility bills as per our example
Go back to Scenario Manager window by clicking OK. Now the Scenario Manager dialog box will look like:
The first scenario has been created. Now create the scenario 1 and scenario 2 following the above steps which depicts the changes in the given scenario.
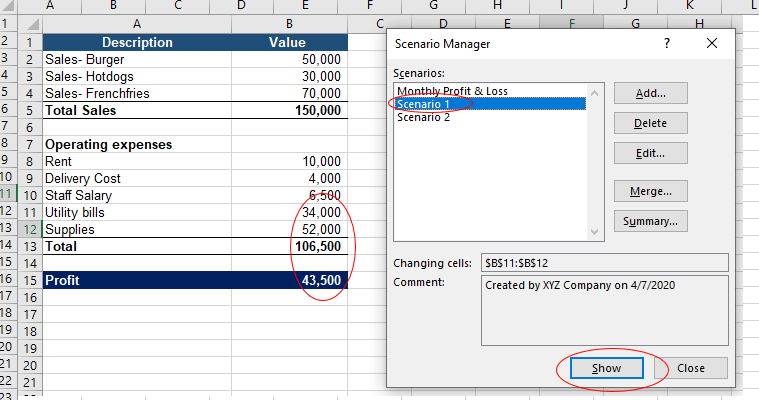
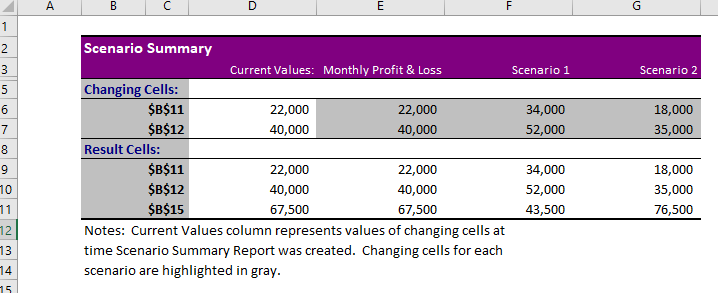
In case of scenario 1 change the values of utility bills and supplies to 34,000 & 52,000 respectively.
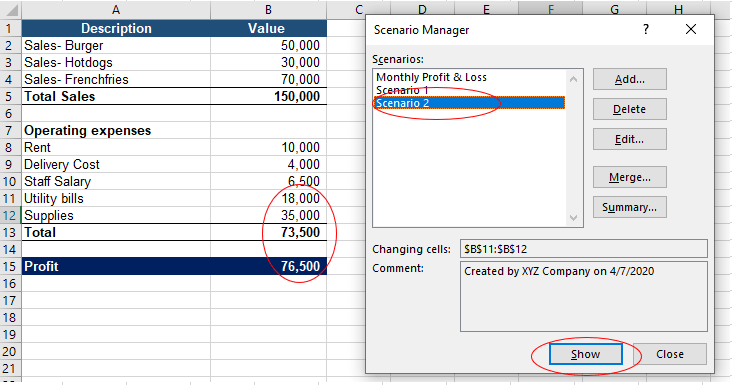
In case of scenario 2 change the values of utility bills and supplies to 18,000 & 35,000 respectively.
Now we have Monthly Profit & Loss, Scenario 1 and Scenario 2. Select each scenario one by one, click show, the Scenario Manger function of the Excel will calculate the monthly profit with each Scenario.
Check that by selecting scenario 2, Scenario Manager Function will calculate monthly profit & loss depicting the changed values of utility bills and supplies. You may notice that with Scenario Manager function there is no need to put values each time to see the impact of change values.
Check that by selecting scenario 1, Scenario Manager Function will calculate monthly profit & loss depicting the changed values of utility bills and supplies. You may notice that with Scenario Manager function there is no need to put values each time to see the impact of change values.
Check that by selecting scenario 2, Scenario Manager Function will calculate monthly profit & loss depicting the changed values of utility bills and supplies. You may notice that with Scenario Manager function there is no need to put values each time to see the impact of change values
How to Create Summary Report in Excel
1. Data>Forecast>What-If Analysis>Scenario Manager>Summary
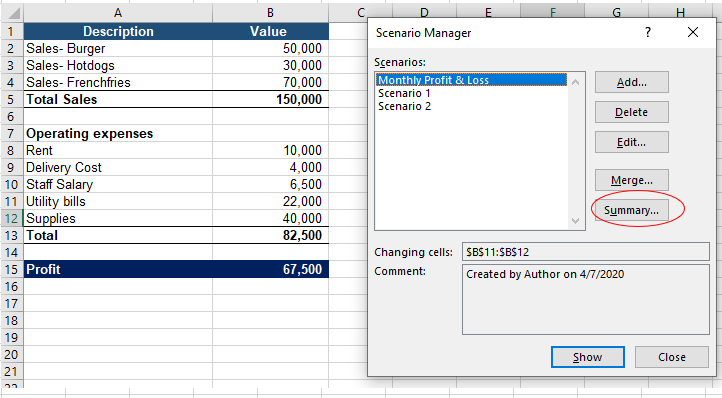
Click Summary and following window will open:
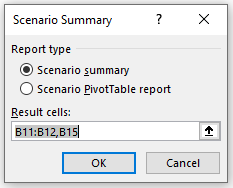
By clicking OK, a Summary will be created in new Excel sheet. Check how Scenario Manager Function has created a summary showing the change under each case and the impact of that change on the profits of the XYZ Company.


0 Comments