

Combining Data From Multiple Sheets in Excel
If you are in a situation where you have data tables spread across multiple sheets and want to run a Pivot Table on the data there is a way to do so if each of the tables has a common denominator.
This is a unique circumstance and one that is not frequently known by users of Excel. This can be a very useful way to save time from having to try to consolidate all the data into one table and then perform the Pivot Table.
Example:
A Financial Analyst has information on customers, products, and sales in separate excel tabs.
The Financial Analyst wants to find out the sales quantity by product and by gender. The product sales listing does not have gender and the customer’s sales listing has a gender but does not have a product.
Therefore, the goal is to combine the customers, products, and sales data into one Pivot Table to analyze.
Formula explanation:
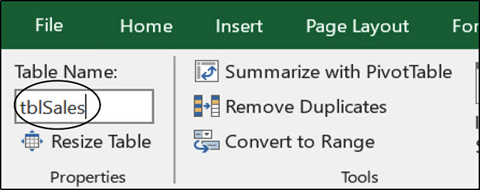
1. Select the data on each tab and create a table in each sheet (e.g. tblSales)
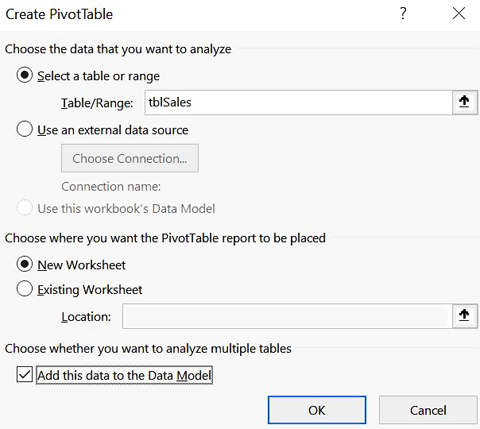
2. Select any of the tables, and go to Insert>Pivot Table. Check on “Add this data to the Data Model”.
3. Go to Analyze>Relationship.

4. Select “New” from Manage Relationships.
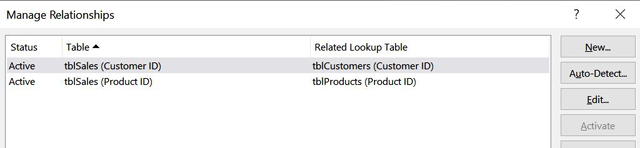
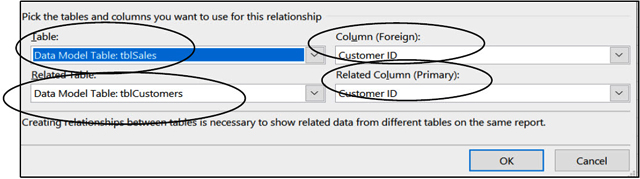
5. Select “tblSales” on Table, and “tblProducts” on the Related Table. Then, Select “Product ID” on both Column and Related Column.
6. Select “New” again.
7. Select “tblSales” on Table, and “tblCustomers” on Related Table. Then, Select “Customer ID” on both Column and Related Column.
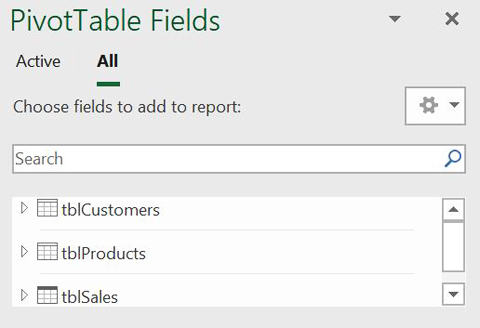
8. Once the Pivot Table is created, select “All” from PivotTable Fields.
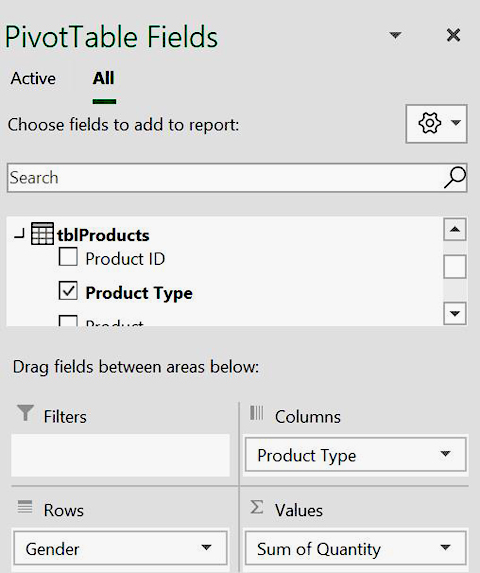
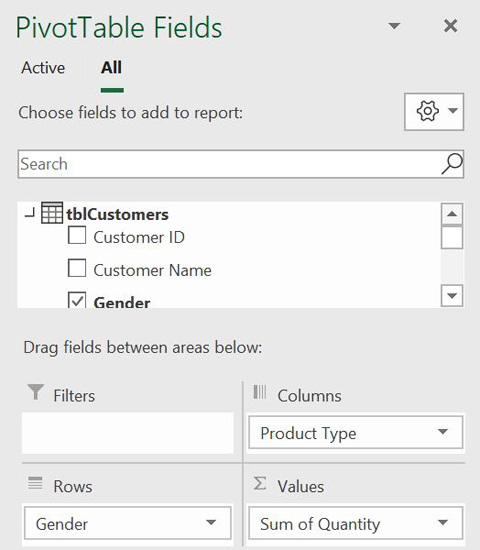
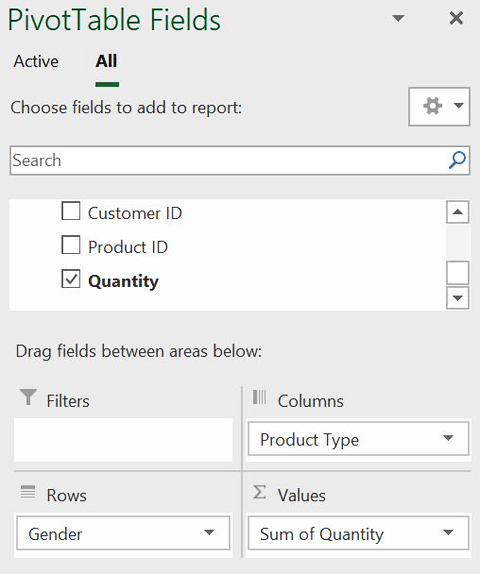
9. Put “Product Type” from tblProducts in the column, “Gender” from tblCustomers into Rows, and “Quantity” from tblSales into Values.
Overall, this can be created without having to consolidate all of the data from each respective tab into one table so this is a powerful technique in which you can leverage the data on multiple tabs to create a pivot from multiple sheets.
The key here is to draw a common denominator between each of the tabs. All 3 of them do not necessarily have to have a common denominator, but you need to be able to draw a common denominator between at least 2 of them.
I hope that helps. Please leave a comment below with any questions or suggestions. For more in-depth Excel training, checkout our Ultimate Excel Training Course here. Thank you!


0 Comments