

How to Use Slicers in Excel
Slicers come in handy after you’ve created a PivotTable and want to further analyze the data with ease. For example, if you are depending on the results of the PivotTable for ongoing analysis, it would be beneficial to set up a dashboard that contained a slicer that enabled the flexibility to view the results of different scenarios.
Steps:
1. Click anywhere in the Pivot table report for which you want to create a slicer.
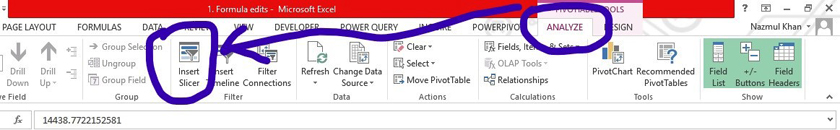
2. Click PivotTable Analyze in the top navigation bar then click Insert Slicer.
3. Tick the field that you want to show on the slicer.
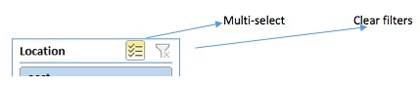
4. When the slicer is open, there is an option to multi-select the options.
Example:
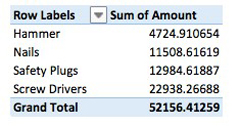
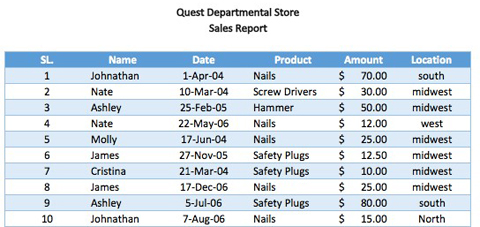
Using the below dataset we would like to create a slicers for product and for a location so that we can easily filter on/off different products and locations in the slicer and determine the resulting product sales.
Raw Data:
Solution:
Below are the slicers we created based on pivoting the raw data:
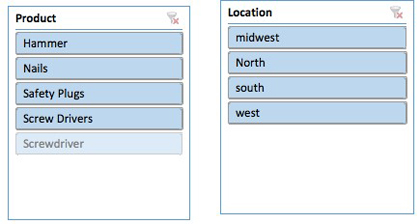
We could multi-select products and locations by clicking on the multi-select icon and it will filter the pivots accordingly. If we click the remove filter button, it will then remove all the filters and all of the products and locations.
*Note this table is only a sample of an example with 5 data entries, and the formulas are based on the whole population of raw data which are not reflected in the example.
As you can see, slicers are a great way to be able to quickly analyze data when you have a pivot table set up and you want to create a dashboard within Excel.
I hope that helps. Please leave a comment below with any questions or suggestions. For more in-depth Excel training, checkout our Ultimate Excel Training Course here. Thank you!


0 Comments