

How to Use the SLOPE Formula in Excel
The SLOPE formula is a statistical function in excel that can be used to return the slope of the linear regression line through data points. The SLOPE formula is the vertical distance divided by the horizontal distance between any two points on the line, which is the rate of change along the regression line. This gives you the rise (y-axis) overrun (x-axis)
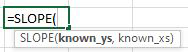
Formula Explanation:
- Known_y’s (required): An array or cell range of numeric values for the y-axis data points.
- Known_x’s (required): An array or cell range of numeric values for the x-axis data points.
In mathematical terms, slope = y2 – y1 / x2 – x1
Example & Solution:
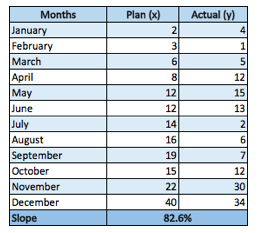
FastCar Company is a car manufacturer. They want to compare plan vs. actual on the performance of their new car for the fiscal year 2019. Below is a summary of the plan and actual unit sales by month for fiscal 2019. We can calculate the slope using the SLOPE formula below the table and graph the plan and actual figures to show the correlation.
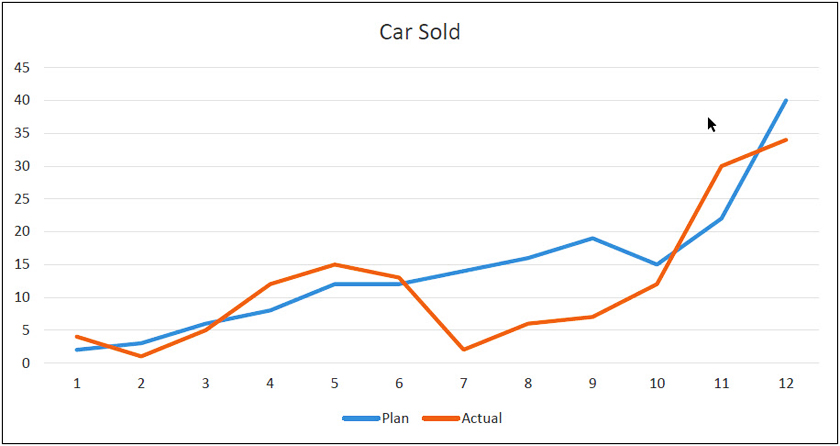
- Just by looking at the statistic, we can get an indication of how closely aligned the 2 were overall throughout the year.
- Overall, the slope is a good figure if you want to calculate the linear regression between two data points, in this case, budget versus actual.
I hope that helps. Please leave a comment below with any questions or suggestions. For more in-depth Excel training, checkout our Ultimate Excel Training Course here. Thank you!


0 Comments