

The AVERAGEIFS Formula returns the average (arithmetic mean) of a range of cells that meet multiple conditions or criteria. This is different than the AVERAGEIF formula as multiple criteria exist that you want to take into consideration when performing the average function.
Formula
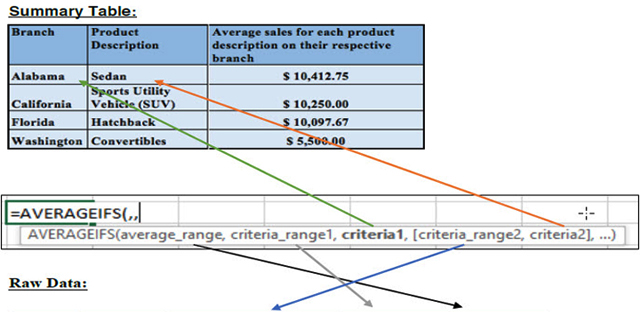
=AVERAGEIFS (average_range, criteria_range1, criteria1, [criteria_range2, criteria2], …)
The formula is comprised of 3 components:
- Average_range (required) – One or more cells to average, including numbers or names, arrays, or references that contain numbers.
- Criteria_range1, criteria2, … (required) – Criteria_range1 is required, subsequent criteria_ranges are optional. 1 to 127 ranges in which to evaluate the related criteria.
- Criteria1, Criteria2 (required) – Criteria1 is required, subsequent criteria are optional. 1 to 127 criteria in the form of a number, expression, cell reference, or text that define which cells will be averaged.
Example:
The General Manager of a second-hand car dealership wants to know the average sales for a certain product on each branch for the current year.
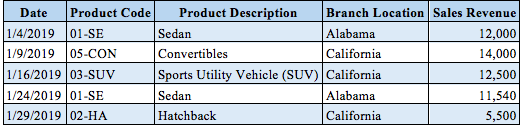
The Finance Analyst generates from its Sales Journal the raw data of its sales from the current year.
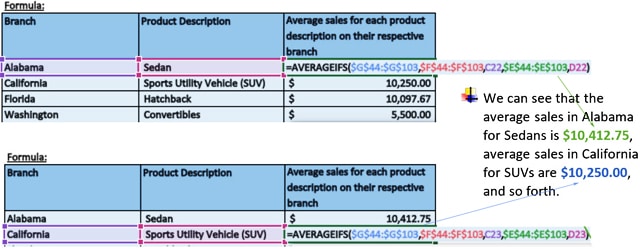
We can see that the average sales in Alabama for Sedans is $10,412.75, average sales in California for SUVs are $10,250.00, and so forth
Here,
- Average_range formula was used for determining the branch’s sales revenue.
- Criteria_Range1 formula was used for determining the data range of a specific branch location.
- Criteria1 formula was used for determining a specific branch location.
- Criteria_range2 formula was used for determining the data range of what type of product should be averaged in a specified branch location.
- Criteria2 formula was used for filtering the specified product description.
Note that the formula is only taking into consideration sales that occurred in Alabama and which are Sedans so it is an ‘And’ formula not an “Or” condition as part of the formula.
What does this data tell us?
The data tells us that whenever there was a sale in Alabama for Sedans, the average of those sales was $10,412.75 per day that there was an occurrence. We also have the rest of the statistical data available for California, Florida, and Washington that the general manager wanted us to obtain and report back.
I hope that helps. Please leave a comment below with any questions or suggestions. For more in-depth Excel training, checkout our Ultimate Excel Training Course here. Thank you!


0 Comments