How to Use the FORECAST Formula in Excel
The FORECAST formula in Excel is used to create a prediction about an item (e.g. sales, profit, etc.) by using previous results as a basis.
There is a limitation in the simplicity of this forecast formula. This formula provides a prediction based on historical results and trends. It cannot be taken as an accurate forecast if other variables may influence the outcome.
Formula explanation:
- X: It is the data point for which you want to predict a value and must be a numeric value.
- known_ys: It is the dependent array or range of numeric data.
- known_xs: It is the independent array or range of numeric data. The variance of known_xs must not be zero.
Example #1:
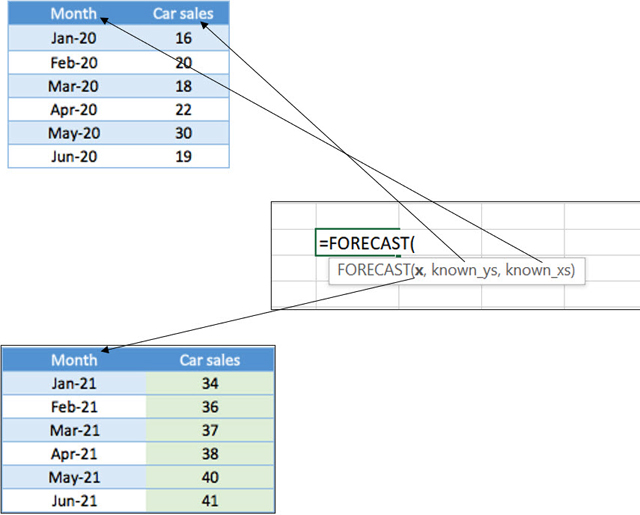
We have the monthly sales for cars at a Toronto dealership for part of 2020 in the below table. Based on this data, we would like to forecast the sales for the same periods for the year 2021.
Solution #1:
We can use the FORECAST formula in excel to create the forecast based on the months we are analyzing for 2020 and the forecast months for 2021.

In our formula:
- x is the month for which we want to predict car sales.
- known_ys are the historical months.
- known_xs are the historical car sales in the historical months.
Example #2:
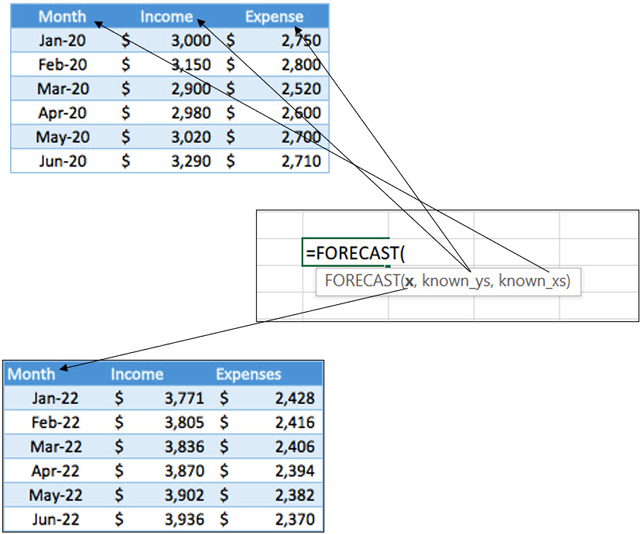
The below report shows monthly income and expense for the XYZ company for 2020. The company’s FP&A analyst wants to forecast the same months for 2022 using this data as the basis of the forecast.
Solution #2:
Using the above table and the FORECAST formula in excel, we can forecast the 2022 monthly income and expense for the same months.

In our formula,
- x is the month for which we want to predict Income and Expense.
- known_ys are the set of income (when forecasting income) and expense (when forecasting expense) of 2020.
- known_xs are the set months of 2020.
I hope that helps. Please leave a comment below with any questions or suggestions. For more in-depth Excel training, checkout our Ultimate Excel Training Course here. Thank you!


0 Comments